
Greyhound Sectional Times: What They Tell You About a Dog
The Splits That the Finish Time Hides
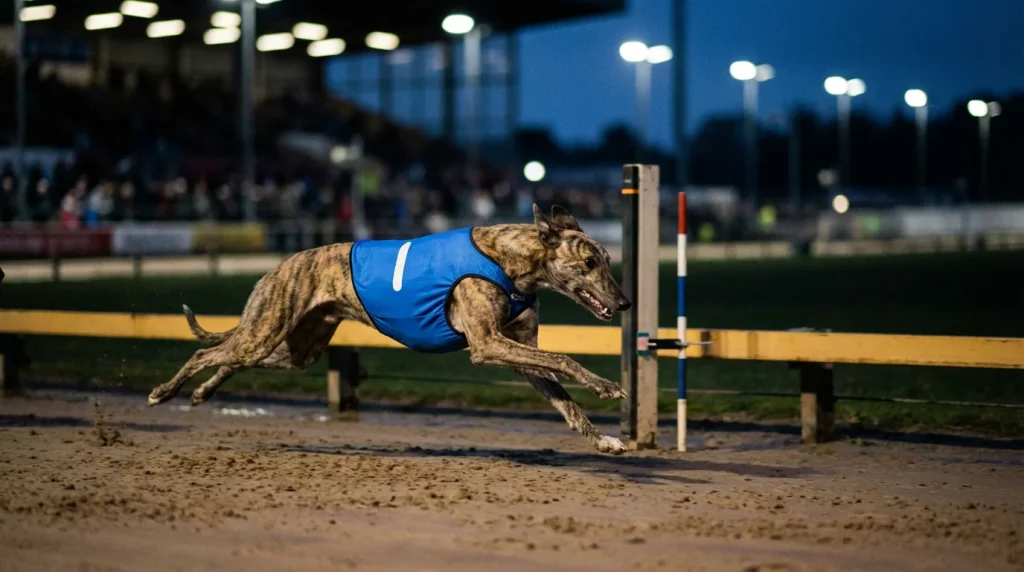
A greyhound’s overall race time tells you how fast it ran from start to finish. It does not tell you how it ran — whether it exploded from the traps and faded in the straight, or whether it began slowly and powered home in the final 100 metres. Sectional times break the race into segments, and each segment reveals something different about the dog’s ability, running style, and tactical profile. For forecast bettors, who need to predict not just who wins but who finishes second, sectional times are the closest thing to a diagnostic tool that the sport provides.
Two dogs can record identical overall times and be completely different propositions for a forecast. One may be a front-runner that leads by three lengths at the second bend and holds on. The other may be a closer that is last at the first bend but covers the final section faster than anything else in the field. The overall time treats them as equals. The sectional times show you they are nothing alike — and that difference determines how each performs in different race shapes, from different trap draws, against different types of opponents.
What Sectional Times Are
Sectional times are the individual timings for specific segments of a race, measured by timing equipment positioned at fixed points around the track. A standard UK greyhound race over 480 metres might be split into three sections: the run from the traps to the first bend (roughly the first 100 metres), the middle section covering the back straight and second bend, and the run-in from the final bend to the finishing line.
The first-section time is the most frequently cited and the most analytically valuable. It measures early pace — how quickly the dog leaves the traps and reaches the first turn. This section correlates most strongly with finishing position because, as we have seen, the first-bend leader wins disproportionately often. A dog with a consistently fast first section is a strong candidate for leading the race.
The middle-section time measures sustained speed through the body of the race. Dogs that run fast middle sections are maintaining their pace when others are beginning to slow. This is a sign of genuine stamina and competitive resilience. For forecast selection, a fast middle section combined with a moderate first section suggests a dog that will be close to the pace at the first bend and strong through the second — a classic runner-up profile.
The final-section time measures closing speed. Dogs with fast final sections are finishers — they pick up beaten dogs in the home straight. In isolation, a fast finish looks impressive, but it can be misleading. A dog might record a fast final section not because it is genuinely fast but because it was so far behind early that it was running in clear air while the leaders were checking each other. The context of the overall race matters as much as the raw split.
How to Access Sectional Times
Not all race cards include sectional times as standard, and accessibility varies by track and data provider. Timeform is the most comprehensive commercial source, publishing sectional data for most GBGB meetings alongside their race card analysis. The Racing Post includes some sectional data in its greyhound form, though coverage can be inconsistent across tracks.
Some tracks publish their own timing data, either on their website or via their in-house race card. Romford, Hove, and Nottingham are among the tracks that provide sectional splits as part of their standard results output. When betting at a specific track, check whether their results page includes timing splits — if it does, you have a free and reliable source of sectional data for every meeting.
For punters who are serious about using sectional times, building your own database is the most effective approach. Record the first-section time for every dog in every race at your preferred track over a period of weeks. After twenty or thirty meetings, you will have a personal dataset that reveals which dogs are genuinely fast early, which are closers, and which are inconsistent. This data does not expire quickly — a dog’s early-pace profile tends to be stable across a racing season, so the investment in recording pays off over months of betting.
Interpreting the Splits
The value of sectional times lies in comparison rather than absolutes. A first-section time of 4.18 seconds means little in isolation — you need to know what the typical first-section time is at that track, at that distance, in those conditions. If the track average is 4.25, a dog running 4.18 has genuinely fast early pace. If the average is 4.15, the same dog is slightly below par.
Build your comparisons within the same track, distance, and grade. A sectional comparison between a dog running at Romford over 400 metres and one at Monmore over 480 metres is meaningless — the distances, track profiles, and timing-point positions are different. Compare like with like, and the sectional data becomes genuinely predictive.
When analysing a race card for forecast purposes, extract the first-section times for all six runners from their recent form. Rank them. The two fastest first-section dogs are your primary forecast candidates — they are the most likely to be in front at the first bend, and the first bend is the strongest predictor of finishing order. If those two dogs are drawn in favourable traps (inside for railers, outside for wide runners), your forecast has structural support from both pace data and draw analysis.
Watch for improving sectional trends. A dog whose first-section times have been getting faster over its last three or four races is sharpening — it is finding its speed and may be about to reach peak performance. Conversely, a dog whose first-section times are slowing may be losing its edge, and its recent finishing positions may not reflect its current ability. The sectional trend tells you whether the dog is on the way up or down, which the raw form figures alone cannot always reveal.
Middle and final sections add nuance. A dog with a moderate first section but the fastest final section in the field is a closer — it finishes races strongly but needs the leaders to slow down or make mistakes. This dog is a second-place candidate in a forecast, not a first-place candidate, because it relies on things going wrong for the front-runners. A dog with the fastest first section and a moderate final section is a pace-setter that leads but may weaken — it is a strong first-place candidate if the race unfolds cleanly, but it is vulnerable to a sustained challenge from a dog with better middle-section speed.
Using Sectional Times for Forecast Selection
The practical application follows a hierarchy. First, identify the two fastest first-section runners — these are your primary forecast pair. Second, check whether their trap draws support the pace reading. Third, look at the middle and final sections to assess whether either dog is likely to weaken or whether a third dog has the closing profile to overtake one of your selections.
If the first-section data suggests a clear leader and a clear second, your straight forecast writes itself. If the two fastest first-section dogs have very similar splits and could contest the lead, a reverse forecast covers both orders. If a third dog has significantly faster middle and final sections and could overhaul the leaders, a combination forecast including all three may be warranted — but only if the dividend expectation justifies the additional cost.
Sectional times are most powerful when they contradict the market. If a dog has the fastest first-section split in the race but is trading at 5/1 because its recent finishing positions were poor (due to bad draws or rough races), the sectional data is telling you the dog has the pace to lead if it gets a clean run. That is exactly the kind of discrepancy where forecast bettors find genuine value.
Timing the Intangible
Sectional times convert instinct into data. The punter who watches a race and thinks “that dog was flying at the first bend” is making an observation. The sectional time confirms or denies it with a number. Over time, aligning your visual impressions with the recorded splits sharpens your eye and gives you confidence in your assessments. The dogs that look fast at the bend and run fast at the bend are your forecast anchors. The data proves it.
Get more race analysis at greyhoundforecast.
Also read our how weather affects greyhound racing bets.