
Trap Draw Bias and Greyhound Forecasts: Track-by-Track Data
The Numbers Behind the Traps
Trap draws are not neutral — every UK track has measurable biases, and they shift with conditions. In a perfectly fair six-dog race, each trap would produce a winner roughly 16.7% of the time. That theoretical baseline almost never holds in practice. Track geometry, bend profiles, the run to the first turn, and even the width of the starting boxes all contribute to persistent advantages for certain trap positions at certain venues.
For forecast bettors, trap bias is not just a curiosity — it is actionable data. If a particular trap wins 20% of races at a given track while another manages only 12%, that information directly affects which dogs you favour for first place. And because forecast bets require you to identify the first two finishers, understanding which traps tend to produce placed dogs (not just winners) is equally important. The trap that produces the most winners is not always the trap that produces the most seconds.
This article examines what trap bias actually means, where it comes from, how the data looks across GBGB tracks, and how to fold it into your forecast selections without overweighting a single variable.
What Trap Bias Actually Means
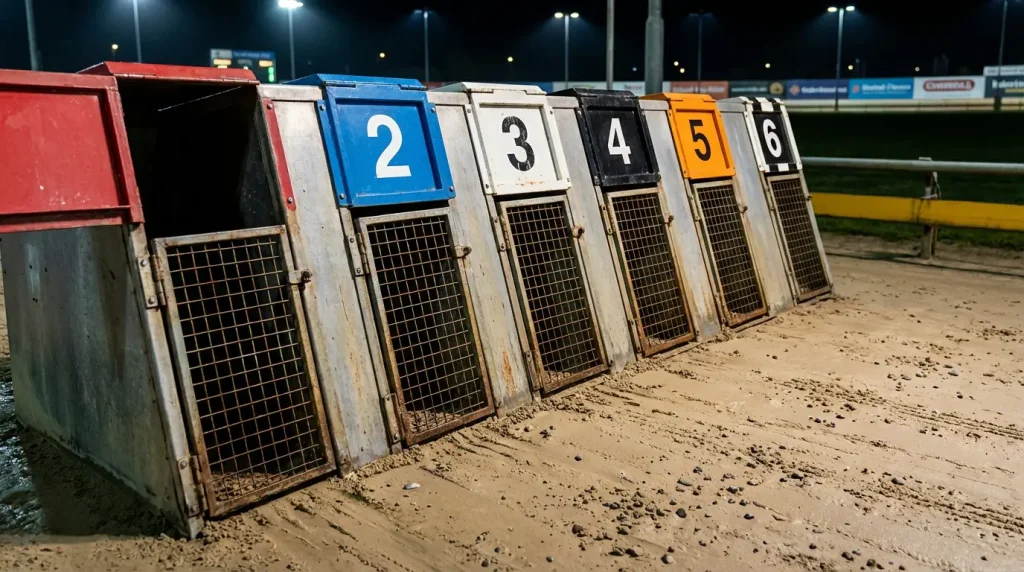
Trap bias means certain traps win disproportionately often at a given track. The cause is mechanical, not mystical. It comes down to track design. At every greyhound track, the starting boxes are positioned on a straight, and the first bend follows at a set distance. The trap closest to the inside rail — Trap 1 — has the shortest path to the bend and the first option on the rail position. The trap furthest out — Trap 6 — has to cover more ground to reach the bend and risks being squeezed toward the outside.
At tracks with a short run to the first bend, Trap 1 and Trap 2 tend to show positive bias because inside dogs reach the turn first and can hold the rail. At tracks with a longer run-up, the bias often shifts toward the middle traps (3 and 4) or the outside (5 and 6), because dogs in those positions have more room to build speed before the bend arrives, and the field spreads out rather than bunching.
Bias also exists for placed finishes. A trap that produces lots of winners may not produce many seconds if the winning dog tends to clear the field by the first bend. Conversely, traps that rarely produce outright winners may still produce a disproportionate number of runners-up — dogs that run consistently in second without having the pace to lead. For forecast selection, both dimensions matter: you need a winner trap and a placed trap, and they may not be the same.
Weather and track conditions can also influence bias in the short term. Heavy rain can make the inside rail slower if drainage is poor on that side. Wind direction affects dogs differently depending on their position relative to exposed sections of the track. These are transient effects, not permanent biases, but they are worth monitoring on the night.
UK Trap Statistics: What the Data Shows
The 2026-25 trap statistics across GBGB tracks reveal persistent patterns that forecast bettors can exploit. While exact percentages shift from year to year, the structural biases tend to remain stable because they are driven by fixed track geometry rather than the dog population.
At Towcester, Trap 1 has consistently recorded the highest win rate among GBGB tracks, often reaching 20% or above over a full calendar year. The wide, sweeping bends and the rail advantage make the inside position valuable here, particularly at standard distances. Trap 6 at Towcester also performs reasonably well — the wide track allows outside runners to avoid crowding — while the middle traps (3 and 4) tend to underperform slightly.
At Romford, the bias picture is more balanced. The long straights reduce the first-bend advantage, and trap win percentages cluster closer to the 16-17% average across all positions. Romford is one of the fairer tracks in the UK from a trap-bias perspective, which makes it harder to gain an edge from draw alone but easier to trust form and speed figures as reliable indicators.
Harlow has historically shown a strong bias toward Trap 6, with the outside position reaching win rates above 20% in some years. The short run to a sharp first bend at Harlow means wide-running dogs from Trap 6 avoid the inside traffic and can establish position before the crowding starts. This is a useful piece of data for forecast bettors: at Harlow, your first-place selection from Trap 6 has a genuine statistical tailwind.
Sheffield shows moderate bias toward the lower traps at sprint distances, while its longer-distance races tend to favour the middle traps as the field sorts itself out over more ground. Monmore’s tight bends create periodic bias toward Trap 1, though the effect is less pronounced than at Towcester. Hove is relatively neutral, with no single trap dominating across distances — which is part of what makes it a fair track for form-based forecast betting.
| Track | Trap with Highest Win % | Approximate Win % | Trap with Lowest Win % | Approximate Win % |
|---|---|---|---|---|
| Towcester | Trap 1 | ~20% | Trap 4 | ~13% |
| Harlow | Trap 6 | ~21% | Trap 3 | ~12% |
| Romford | Trap 1 | ~18% | Trap 5 | ~15% |
| Monmore | Trap 1 | ~19% | Trap 4 | ~14% |
| Hove | Trap 6 | ~18% | Trap 3 | ~15% |
| Sheffield | Trap 2 | ~18% | Trap 5 | ~14% |
These figures are indicative and shift year to year. The important point is the relative pattern, not the exact percentage. Tracks where one trap sits five or more percentage points above the theoretical average of 16.7% have a meaningful bias. Tracks where all traps sit within two or three points of the average are essentially neutral from a bias perspective.
Using Trap Bias for Forecast Selection
If Trap 1 wins 20% at Towcester but only 14% at Romford, your first selection shifts — even if the dogs in Trap 1 at both venues have similar form profiles. This is the practical application of bias data: it adjusts your priors. It does not replace form, but it modifies the weight you give to a dog based on where it is drawn.
For forecast betting specifically, the application works on two levels. First, use bias data to weight your first-place selection. At tracks with strong Trap 1 bias, the dog drawn inside needs less impressive form to warrant consideration as your winner. At tracks with no meaningful bias, form and pace figures carry full weight without any draw adjustment.
Second, think about placed bias. Which traps tend to produce second-place finishes at a given track? This data is less commonly published than win percentages, but you can extract it from results archives. At some tracks, the trap that wins most often also finishes second most often — it simply produces the most finishers in the frame. At others, there is a clear split: one trap leads, another consistently fills the runner-up spot. A classic pattern is Trap 1 winning and Trap 6 finishing second at tracks with wide bends, because the rail runner and the wide runner both avoid the middle traffic.
When you find a race where the dog in the biased trap also has strong form, early pace, and a running style suited to the track — that is a high-confidence forecast anchor. When the dog in the biased trap has weak form or a style that conflicts with the draw, the bias alone is not enough. Data supports decisions; it does not make them.
A practical approach is to maintain a simple table for each track you bet on regularly. List the six traps with their win percentages and their place (first or second) percentages. Update it quarterly using results data from the GBGB or from services like Timeform that publish track-level statistics. Over time, this table becomes a quick reference that takes thirty seconds to consult and saves you from ignoring the most persistent structural factor in UK greyhound racing.
The Bias Within the Bias
Trap bias is a starting point, not an answer — the dog in the trap still has to run. A 20% win rate for Trap 1 at Towcester means that Trap 1 loses 80% of the time. The bias gives you a statistical tailwind, but it does not override a dog with poor form, a slow sectional time, or a running style that does not suit the draw.
The most common mistake with trap bias data is treating it as a standalone system. Backing the highest-bias trap in every race without looking at the actual dog is a guaranteed way to lose money. The bias is a tiebreaker, not a strategy. When two dogs have similar form and you cannot separate them, the one in the stronger trap gets the nod. When one dog has clearly better form but a weaker draw, form wins.
There is also a market efficiency consideration. At tracks where bias is well known and widely discussed — Towcester Trap 1 being the classic example — the betting market already prices it in. Dogs drawn in Trap 1 at Towcester tend to be shorter in the market than their form alone would suggest. This means the bias has already been captured by the odds, and backing Trap 1 blindly does not offer value. The edge comes from combining bias with form analysis that the market has not fully priced — a dog whose form is slightly underrated by the market, drawn in a trap with a persistent structural advantage.
Use the data. Do not worship it.
Get more race analysis at greyhoundforecast.
Also read our early pace in greyhound racing forecasts.